
When it comes to machine learning, an important topic to be discussed is Regression. Once we understand the concepts, then building the models and further improvements will be much easier. To start with, we consider an important topic – Correlation
Correlation
Is there any association between the number of hours one studies and the marks scored?
Is there any relation between the number of temples/churches in the city and the frequency of community riots?
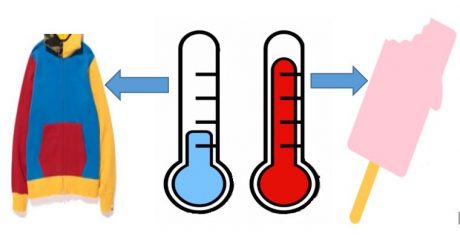
What happens to the sweater sales increase in winter and ice cream sale increase in summer? Or the sweater sales in summer and ice cream sale in winter?’
In all the above cases we know there is some association between the conditions. Also, the association strength varies in each of the above conditions. We need to quantify the associations. So to quantify the association, we use a measure called correlation, so correlation simply quantifies the association.
Correlation is a measure of linear association between two variables as, if one decreases or increases, what happens to the other.
Correlation Coefficient
The correlation coefficient ‘r’ is the ratio of variance together, to the of product of separate standard deviations.
- If r = 0 : No linear association.
- If 0 < r <0.25 : Negligible positive association.
- If 0.25 < 0.5 : Weak positive association.
- If 0.5 < r <0.75 : Moderate positive association.
- If 0.75 < r : Strong positive association.
- If r < -0.75 : Highly negative association.
Generally, correlation takes the values between -1 to +1.
- So, in the sweater sales example, as the temperature increases, the sweater sales go down, this is an inverse association, which is a negative correlation.
- Where as in the Ice-cream sales, as the temperature goes up, the ice-cream sales go up as well, so that is a clear positive association.
r= (covariance of XY ) ÷ ( Sqrt(varianceX * varianceY)
So, to understand the correlation we will just do a small exercise, we will take air passenger ‘s data then we will see what is the correlation between them. This will be followed in the next part of this session.
In next section, we will be studying about practice session on Correlation Calculation in R.
Practice : Correlation Calculation in R

Related Courses

Python(Batch6)
PRIVATE 28
Tableau (Batch6)
PRIVATE 29
PowerBI (Batch6)
PRIVATE 28