
In previous section, we studied about R Environment, now we will be studying about R Packages.
Everything in R is actually a package. Like if we want to do some cluster analysis or customer segmentation & text mining or big data analytics or to connect a particular R to an SPSS dataset, it is not directly possible until and unless that particular package is available to us.R is just a group of packages put together as a tool. For doing every operation in R, we call that particular package and then use it. When we install it, there will be around 30 packages that are downloaded along with the basic version of R. We want to do beyond that which is why we need to install that particular package. Thus, suddenly if we are running some code and it throws an error then there might be a chance that, that particular package is missing. For example, if we want to do some cluster analysis and that cluster analysis package is not there, then we cannot perform cluster analysis.
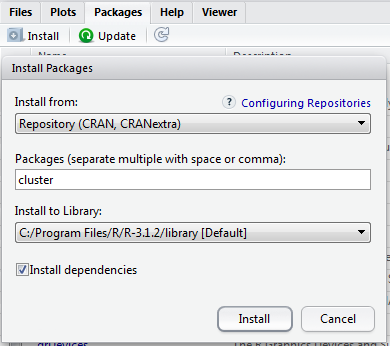
Installing The Packages
Packages are easily available on CRAN R website. Packages are like library function/compiled code/group of functions needs to put together. Here is an example, if we want to draw a 3d scatterplot, i.e., scatterplot3d( x,y,z) and if the 3d scatterplot package is not there in the library then you can’t run the command.
x<-rnorm(1000,mean=20,sd=5)
y<-rnorm(1000,mean=5,sd=3)
z<-rnorm(1000,mean=25,sd=8)
scatterplot3d( x,y,z)
We get an error, could not find the function scatterplot3d. Hence at this point, we have to install that particular package. If we have already installed the package but we don’t attach it then also it throws the same error. Thus, it is not necessary that all the packages which that we have installed in our computer need to be attached. If we have not yet installed it, type the command “install.packages(scatterplot3d)” and the package will get downloaded.
install.packages("scatterplot3d", repos = 'cran.rstudio.com')
library(scatterplot3d)
scatterplot3d(x,y,z)
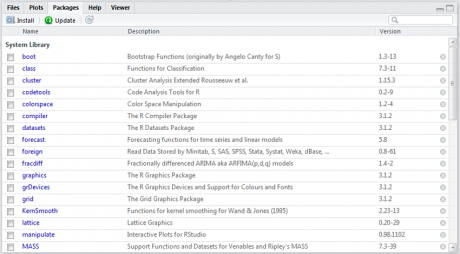
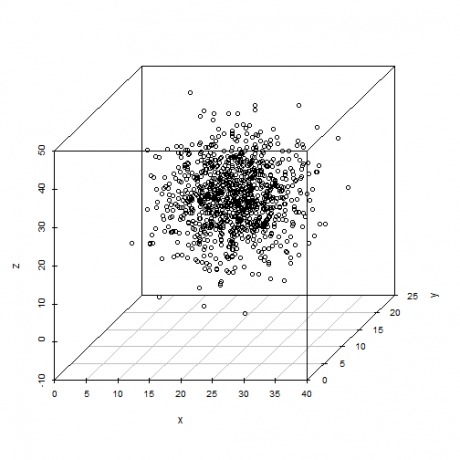
Once it is installed, we need to attach it by the command “library(scatterplot3d)”. And then again call the function, scatterplot3d( x,y,z) and we can see the 3d scatterplot. Or else select the required package from the list
The output of the above command appears as :
Here are some of the useful packages for downloading.
- Data handling: RODBC, RMySQL, etc.
- For Data visualization: ggplot2 is one of the good data visualization packages.
- Other than ggplot2, even Shiny is a package which is giving a lot of competition to the good visualization in the market.
- Some of the advanced analysis packages are also available.
In next section, we will be studying about R Datatypes.


