
In previous section, we studied about, Correlation now we will be studying about Correlation Calculation in R
Let us learn the correlation concepts with an example. Let’s do a lab on correlation calculation, we have a dataset called Air Passengers data then we have to find some correlation in that datasets.
- We have to find the correlation between number of passengers and promotional budget and
- We have to find the correlation between numbers of passengers and inter-metro flight ratio.
- We can get the dataset inside R.
- Dim gives us the size of the data.
- There are 80 rows and 9 columns in this data.
Import Dataset: AirPassengers.csv
air <- read.csv ("datasets\\AirPassengers\\AirPassengers.csv")
dim(air)
>names(air)
"Week_num", "Passengers", "Promotion_Budget", “Service_Quality_Score", "Holiday_week", "Delayed_Cancelled_flight_ind", "Inter_metro_flight_ratio",  "Bad_Weather_Ind", "Technical_issues_ind".
We can actually look at the Air Passenger’s data and try to understand what exactly this data contain. It contains week numbers, the number of passengers and the promotional budget that was spent by that particular airline in that particular week. The promotional budget can be the ticket fairs promotions or marketing TV or billboard marketing or everything that is spent on promoting that particular ticket.Do you think if you spent a lot of money on marketing and giving lower price ticket do you think a number of passengers will be high?
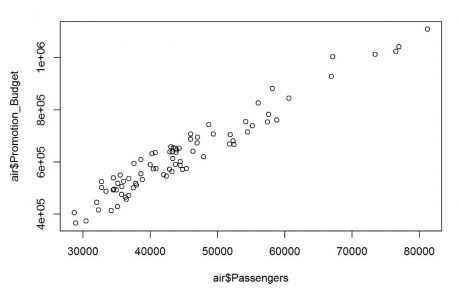
To find the association between 2 variables we need to use a function called correlation (cor). What we are trying to find is the correlation between promotional budget and a number of passengers.
>cor(air$Passengers, air$Promotion_Budget) ## [1] 0.965851 >plot(air$Passengers, air$Promotion_Budget)
It also contains the service quality score: Some airlines, after the flight, take the survey and find out what was the response from the customer that has used that particular airline. So does service quality score have any correlation with the number of passengers, promotional budget or ticket fairs? Does it have any correlation with the number of passengers holiday week? Does it have any correlation with a number of passengers? If there are any higher number of delayed flights does it have any correlation with a number of passengers?
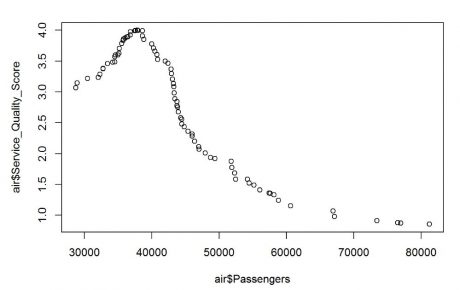
Find the correlation between the number of passengers and the service quality score.
>cor(air$Passengers, air$Service_Quality_Score)## [1] -0.88653>plot(air$Passengers, air$Service_Quality_Score)
Will there be any association between holiday week and the number of passengers? Quantify the association between holiday week and passenger count. What is the correlation?
>cor(air$Passengers, air$Holiday_week)## Error in cor(air$Passengers, air$Holiday_week): 'y' must be numeric
Few weeks have delayed flights. Is there any association between passengers and flight cancellation?
>cor(air$Passengers, air$Delayed_Cancelled_flight_ind)## Error in cor(air$Passengers, air$Delayed_Cancelled_flight_ind): 'y' must be numeric
The next post is about Beyond Pearson Correlation.


Related Courses

Python(Batch6)
PRIVATE 28
Tableau (Batch6)
PRIVATE 29
PowerBI (Batch6)
PRIVATE 28